
We specialize in converting complex scientific, technical, or non-editable charts into fully editable, high-precision visuals. Whether sourced from images, PDFs, scans, or legacy documents, each chart is meticulously rebuilt to preserve data accuracy, visual integrity, and publication-ready formatting. The result is a clean, editable file that can be updated, restyled, or repurposed with ease across PowerPoint, Excel, Illustrator, or other preferred tools.
Every chart is reconstructed with strict attention to numerical accuracy, correct scaling, and faithful representation of the original dataset.
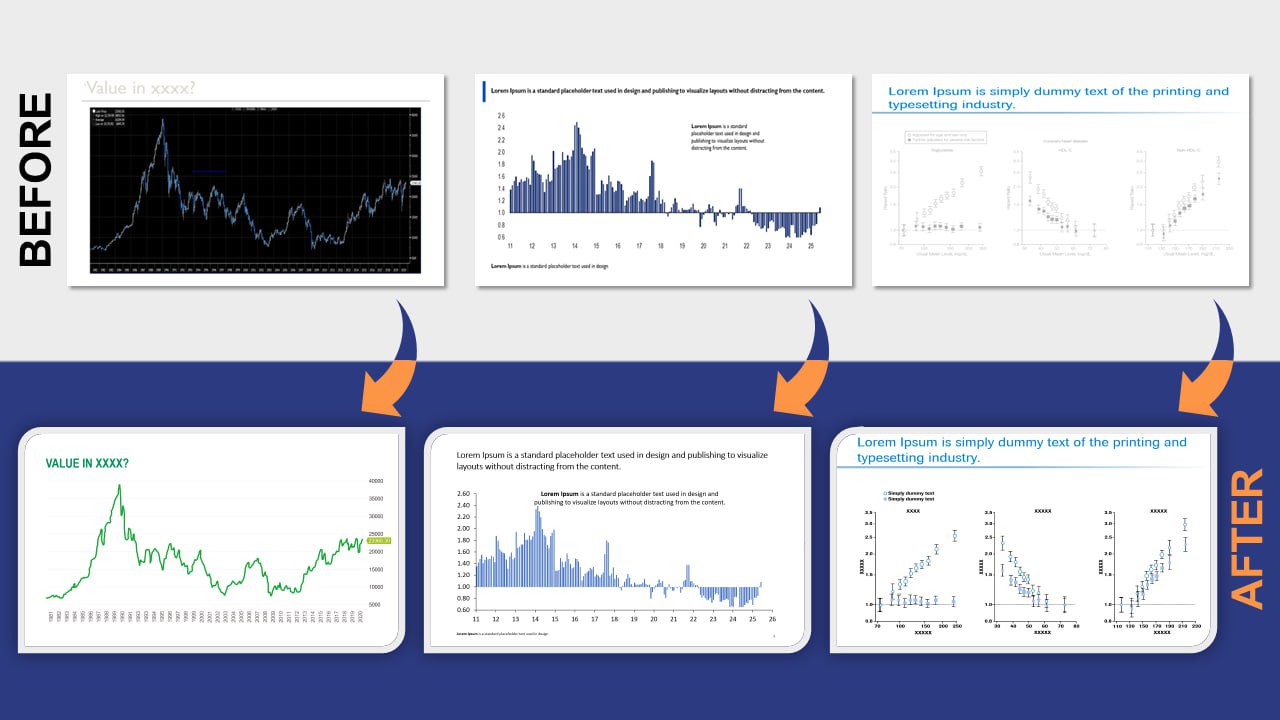
All elements including data points, axes, labels, legends, and annotations are delivered in a fully editable format for seamless future updates.
Complex components such as multi-axis structures, error bars, overlays, confidence intervals, and statistical markers are precisely recreated.
Final outputs are delivered in the format that best fits your workflow: PowerPoint, Excel, Illustrator, or other requested platforms.
Charts can be aligned to scientific journal standards, regulatory requirements, or internal brand guidelines.
Editable charts significantly reduce the time required for revisions, localization, and iterative analysis.
Nearly all scientific and technical charts, including line graphs, bar charts, scatter plots, multi-axis charts, statistical plots, and more.
Images, PDFs, scanned figures, or any non-editable chart formats.
PowerPoint, Excel, Illustrator, or any format requested by your team.
Through careful data extraction, scaling, and validation against the original chart.
Yes. Every component can be modified, updated, or reformatted without rebuilding from scratch.
Absolutely—error bars, annotations, dual axes, overlays, and statistical indicators are all supported.
Yes. We can format charts to meet journal, regulatory, or brand standards.
Depending on complexity, delivery ranges from a few hours to 24 hours.